Home | Site Map | Testimonials | About Us | Contact Us | Oracle® Diabetes Care Line: 1-866-829-7926
Return to Table of Contents
Oracle® Diabetes Management System
Using the Data Menu


In the menu, you can view the blood glucose data in the tabular form.

Point your mouse to data icon to start this function.
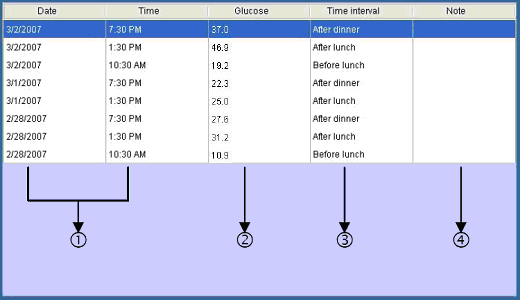
Format of BG data

Click BG Data button, the screen shows as Figure 9.

Figure 9.
xmit


   Column    What it means
   1. Date and Time    Show date and time of the data transferred from the meter’s memory.
   2. Glucose    Glucose readings transferred from the meter’s memory.
   3. Time interval    Reflect what you select from “Measurement interval"
   4. Note    Double click the selected column and type the information of the data for your record.


Construct your BG data

  1. Click BG Data button and the screen shows as Figure10. Select the date interval or a specific date range to organize your data.


  2. Figure 10
    BGData_select


  3. If you select the date interval. Click down arrow and five intervals shows from the drop-down list. Click OKbutton 
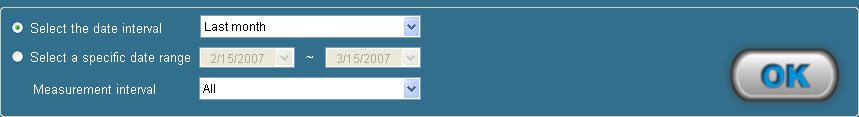
button and your data will be presented at the interval you selected.

  4. If you select a specific date range. Directly type the desired date or click down arrow to select the desired date and the desired measurement interval.

  5. Click OKbutton button to confirm. The data will be presented at the specific interval you selected.


Return to Table of Contents

Now available at: